Screenshot Tour
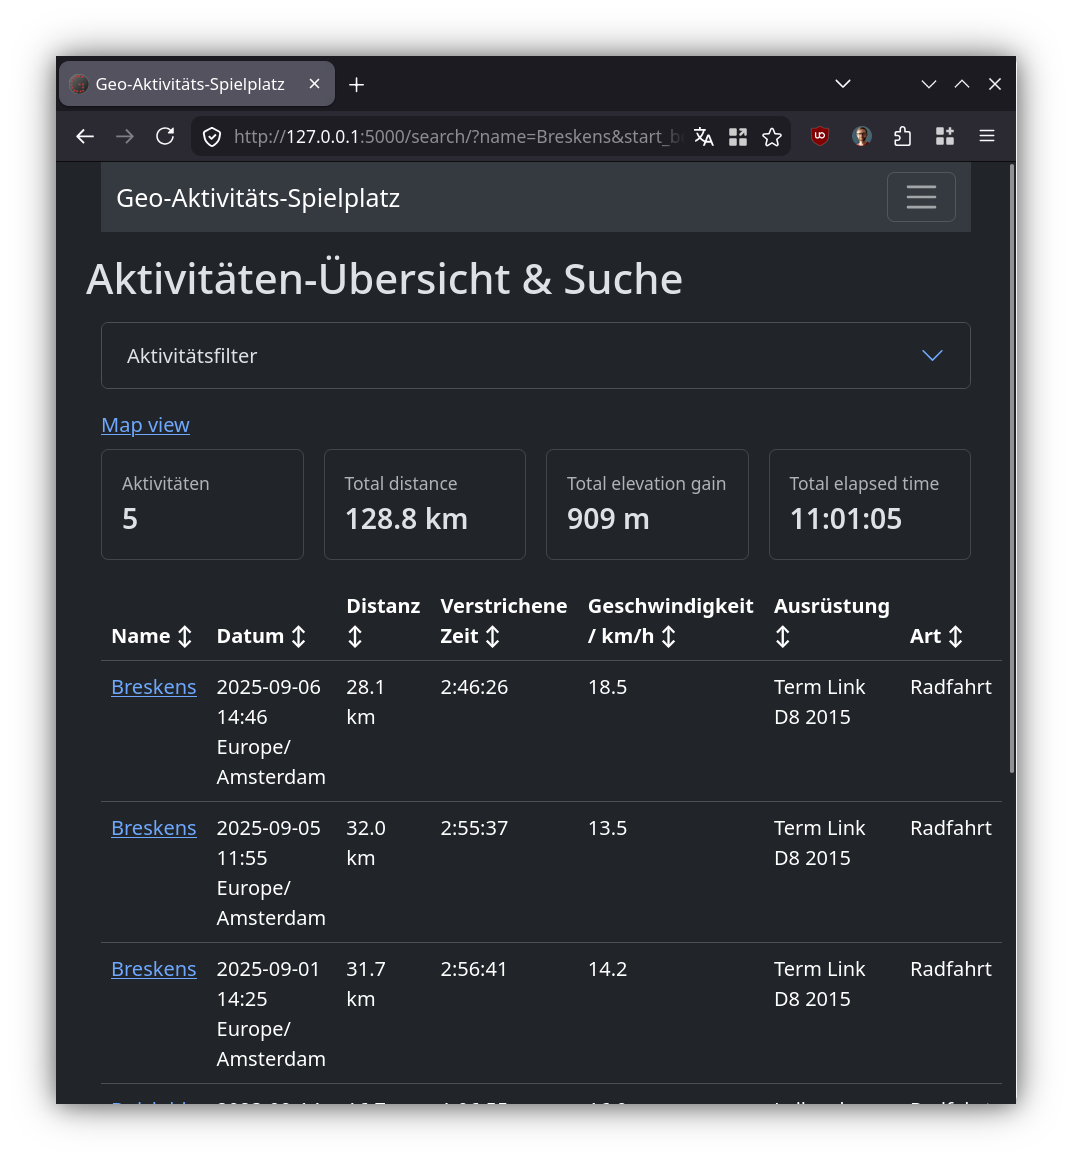
The activity overview lets you search and filter your activities and shows totals for the current selection:
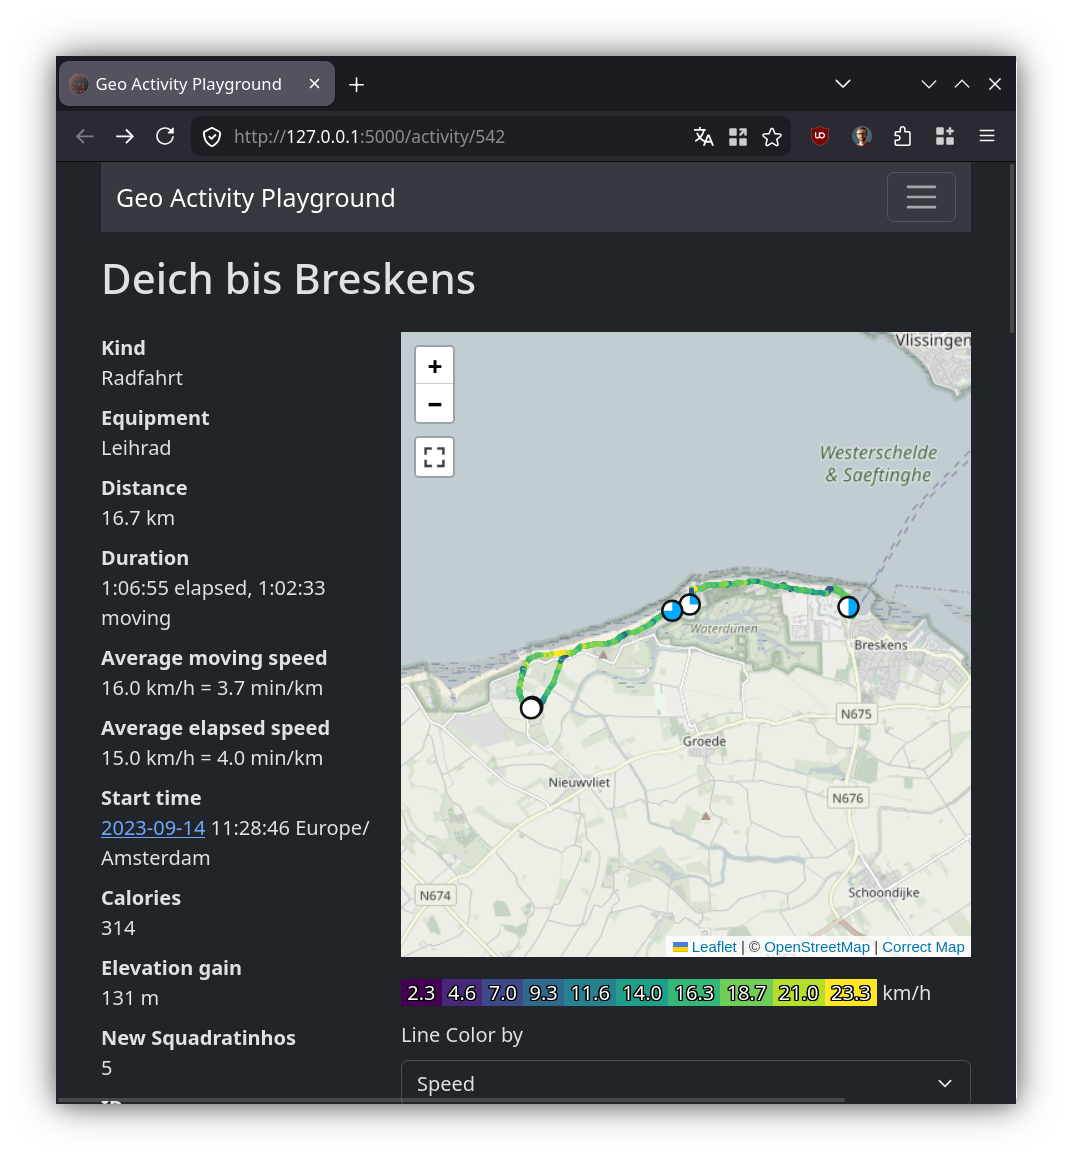
Each activity has its own page with an interactive map:
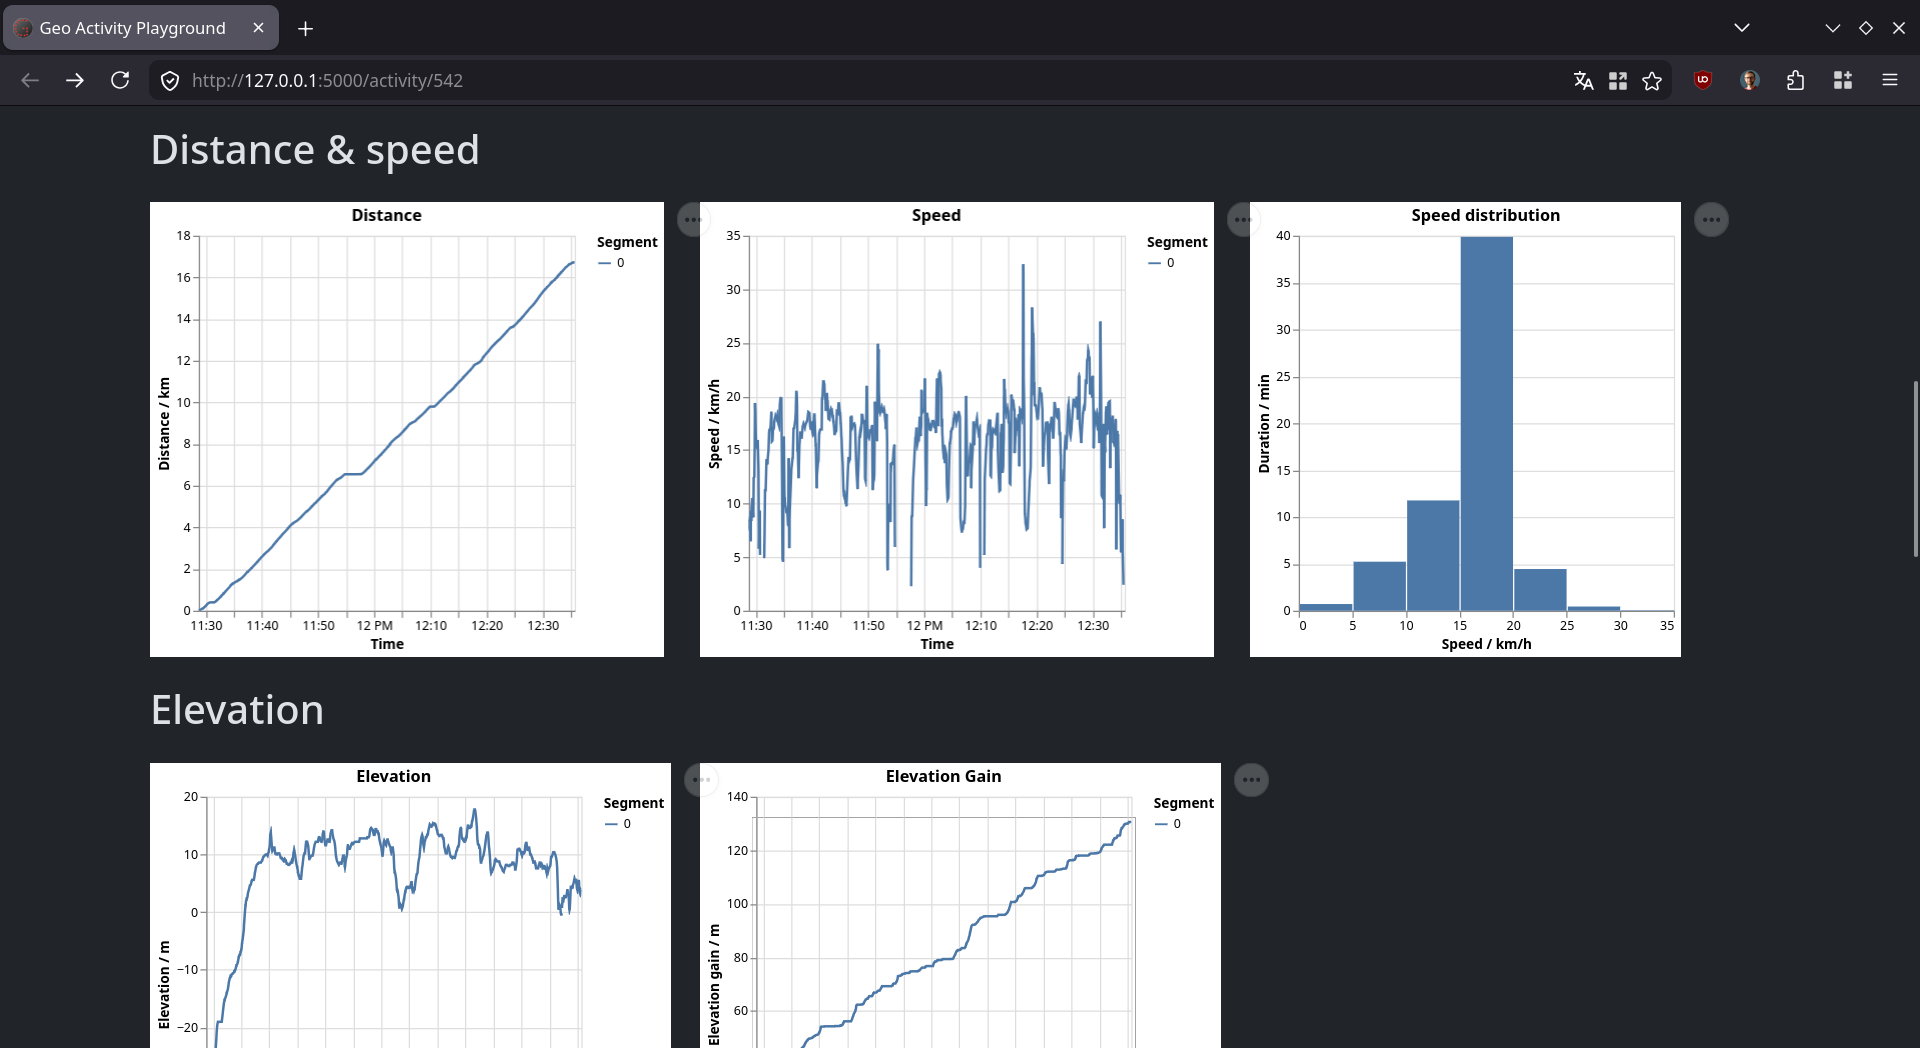
… as well as plots for distance, speed, and elevation over time:
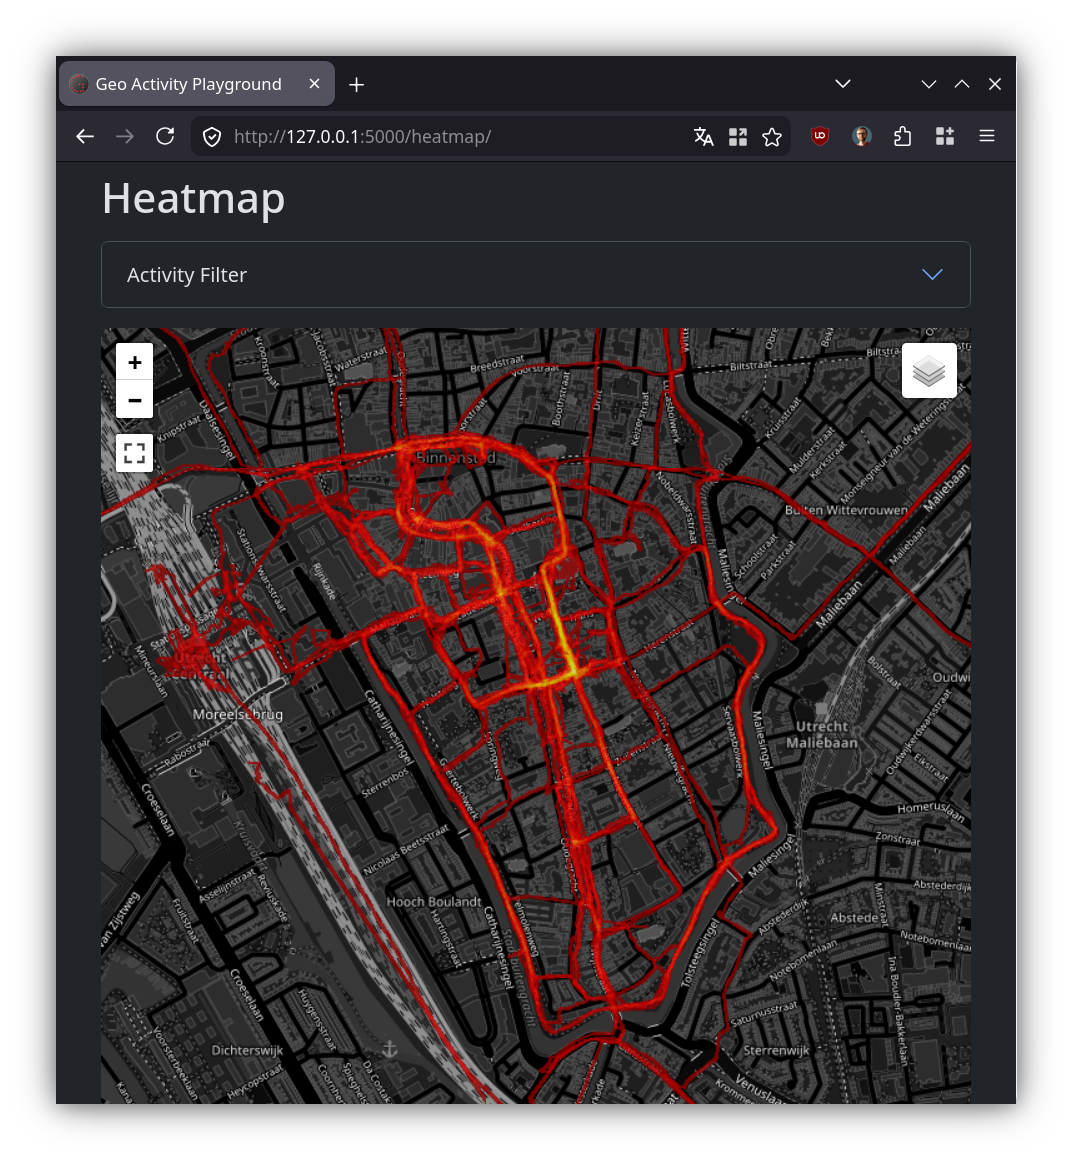
You also get a beautiful interactive heatmap of all your activities:
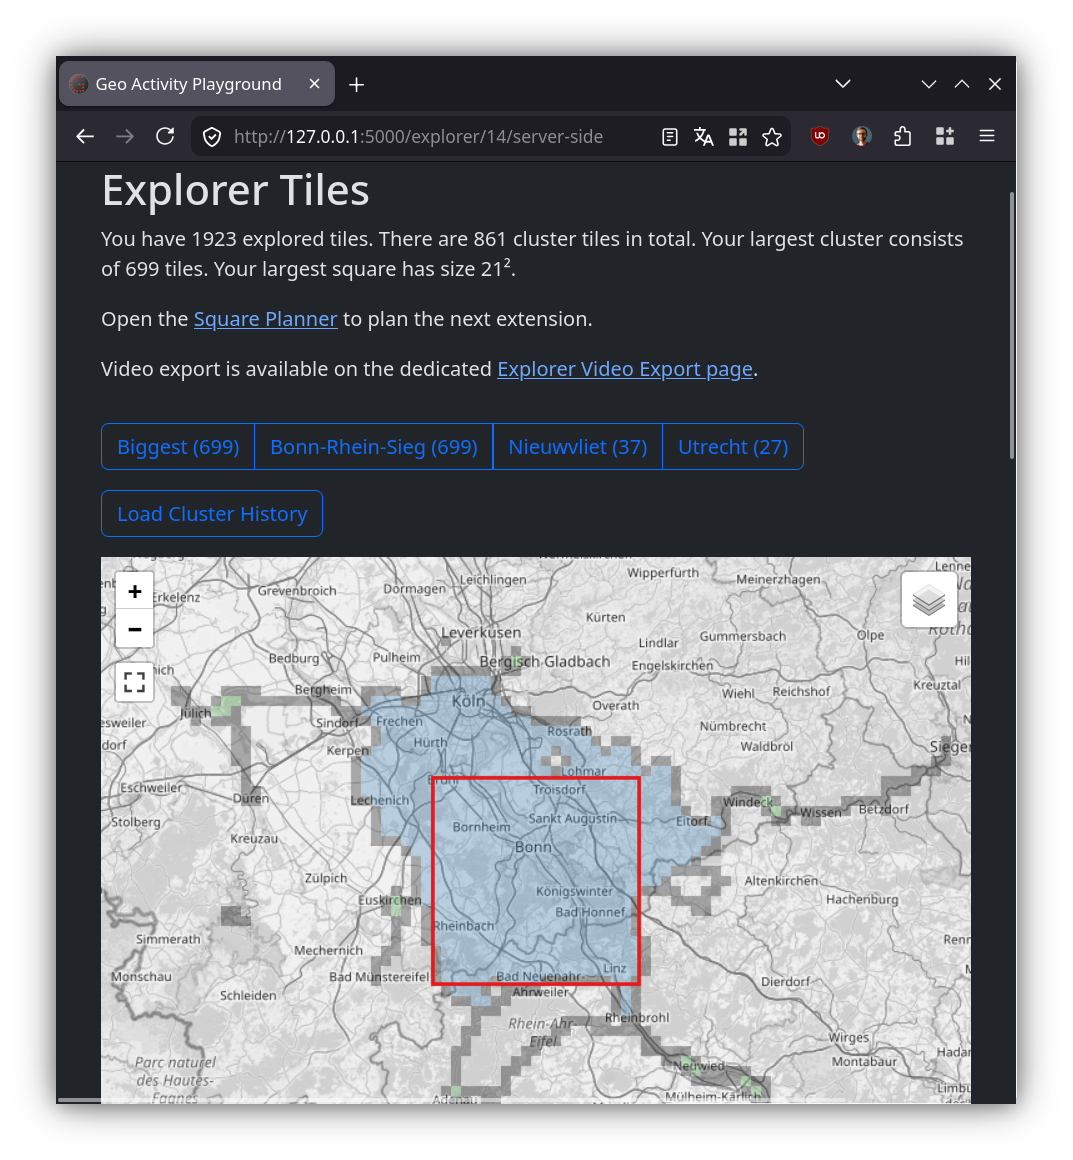
If you're into explorer tiles or squadratinhos, this got you covered. Here is the cluster at zoom level 14 …
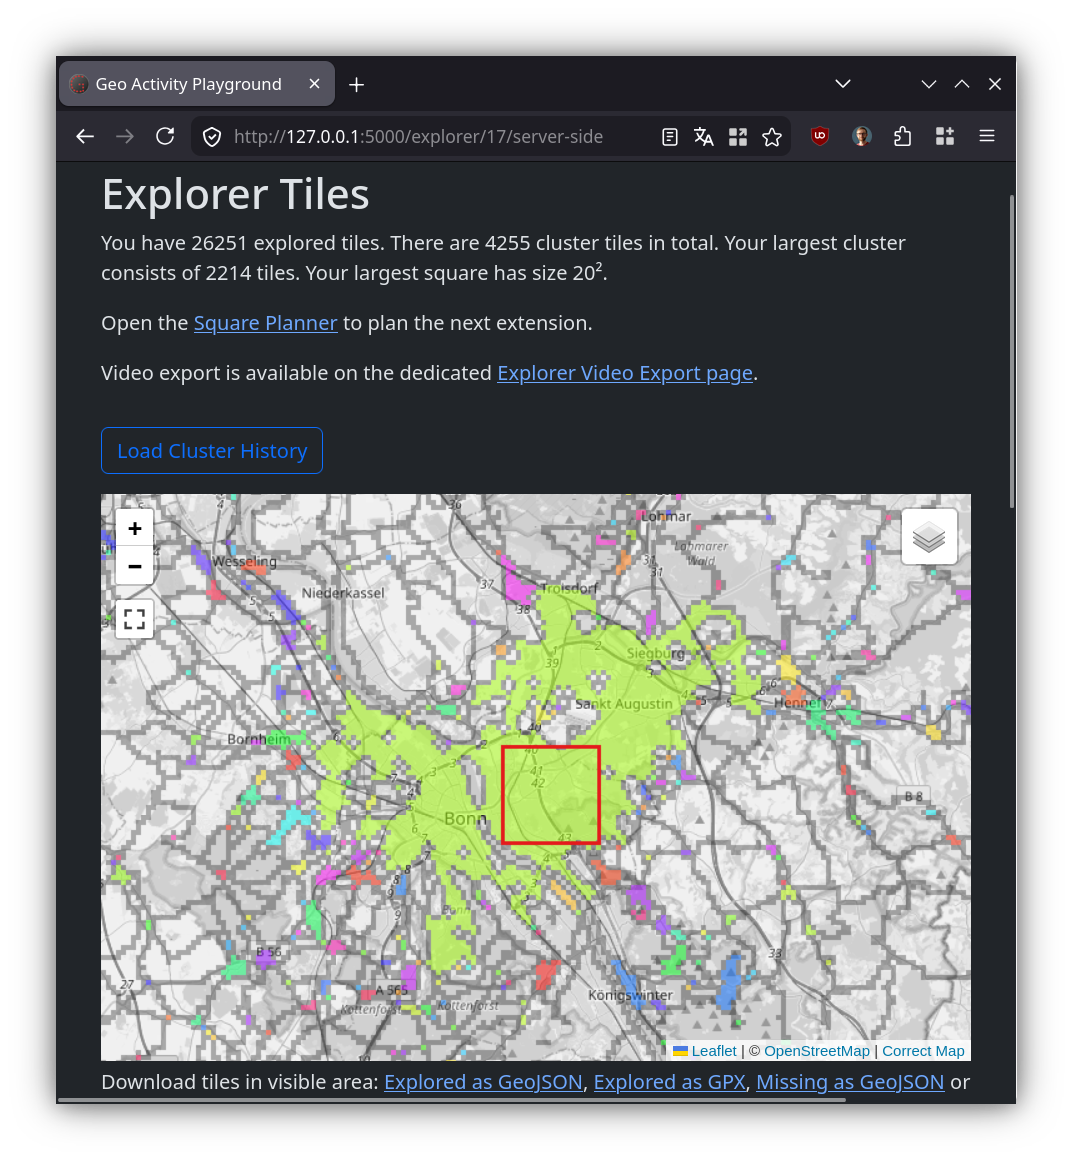
… and the much finer zoom level 17:
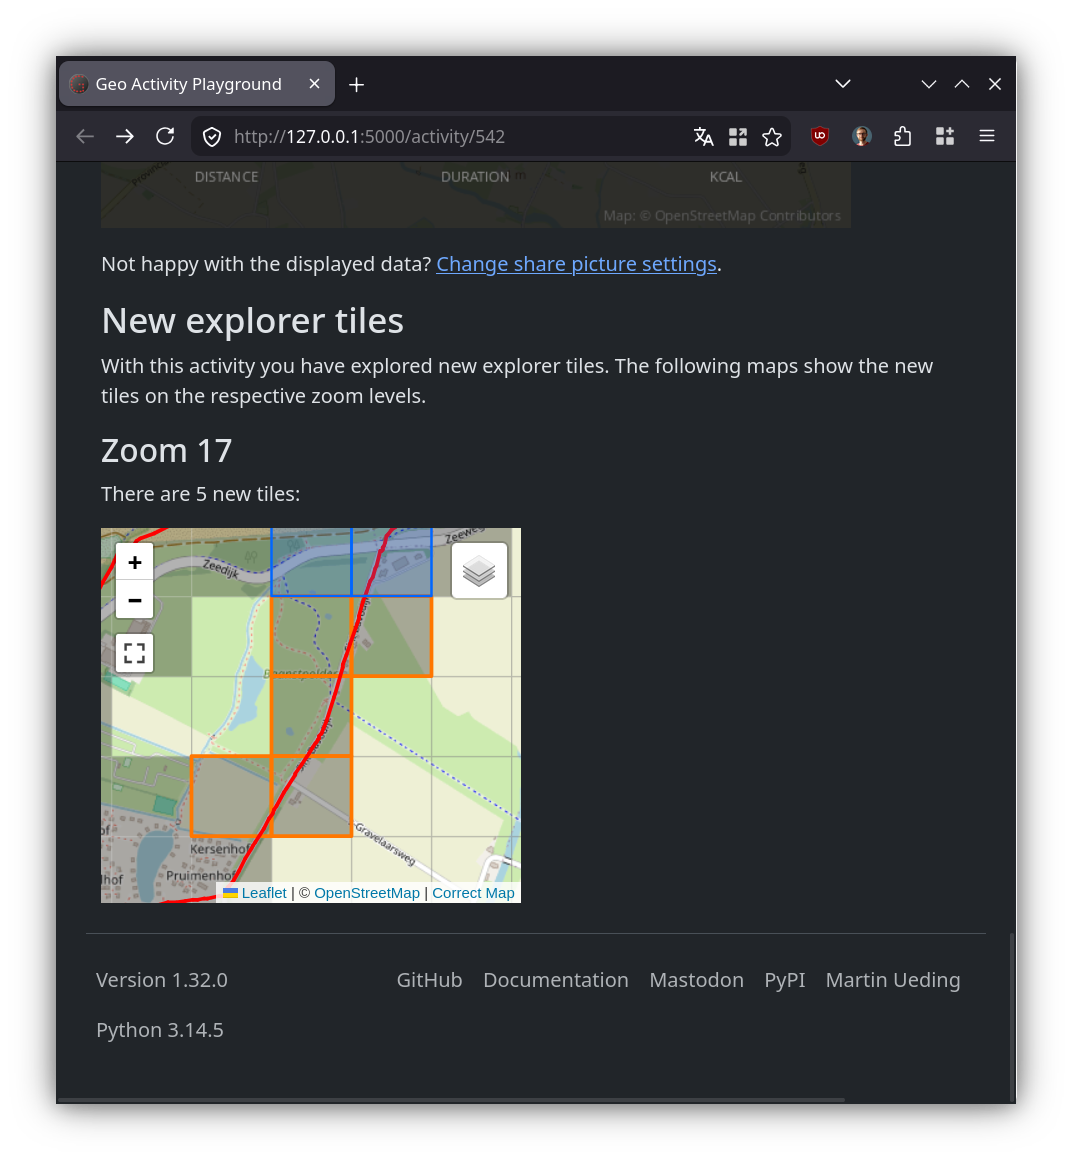
Every activity also shows which explorer tiles you have newly unlocked:
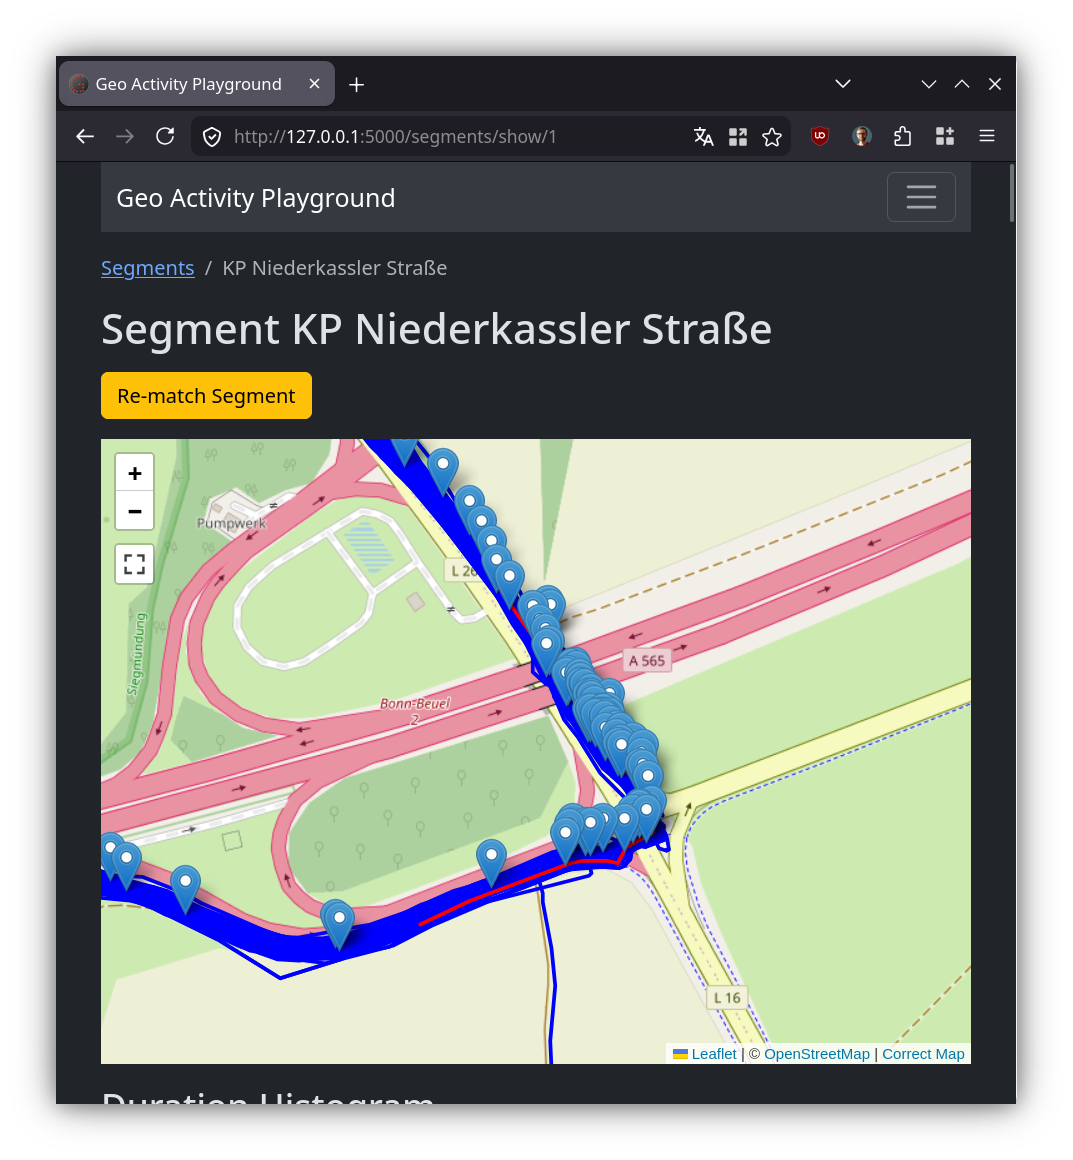
You can define segments along a route and the app matches your activities to them automatically, tracking forward and backward direction separately:
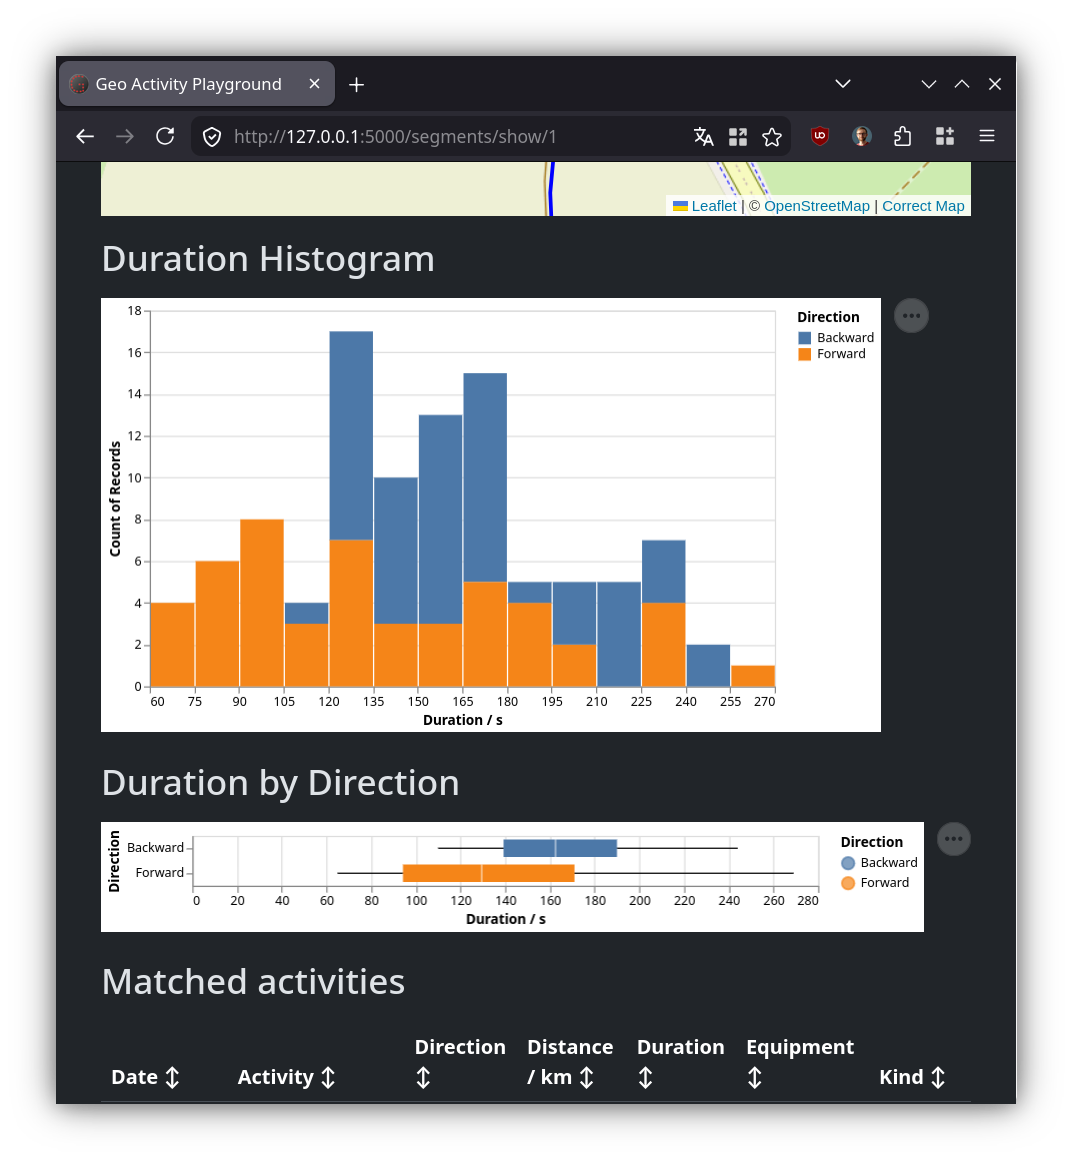
… together with a histogram of how your time on the segment is distributed:
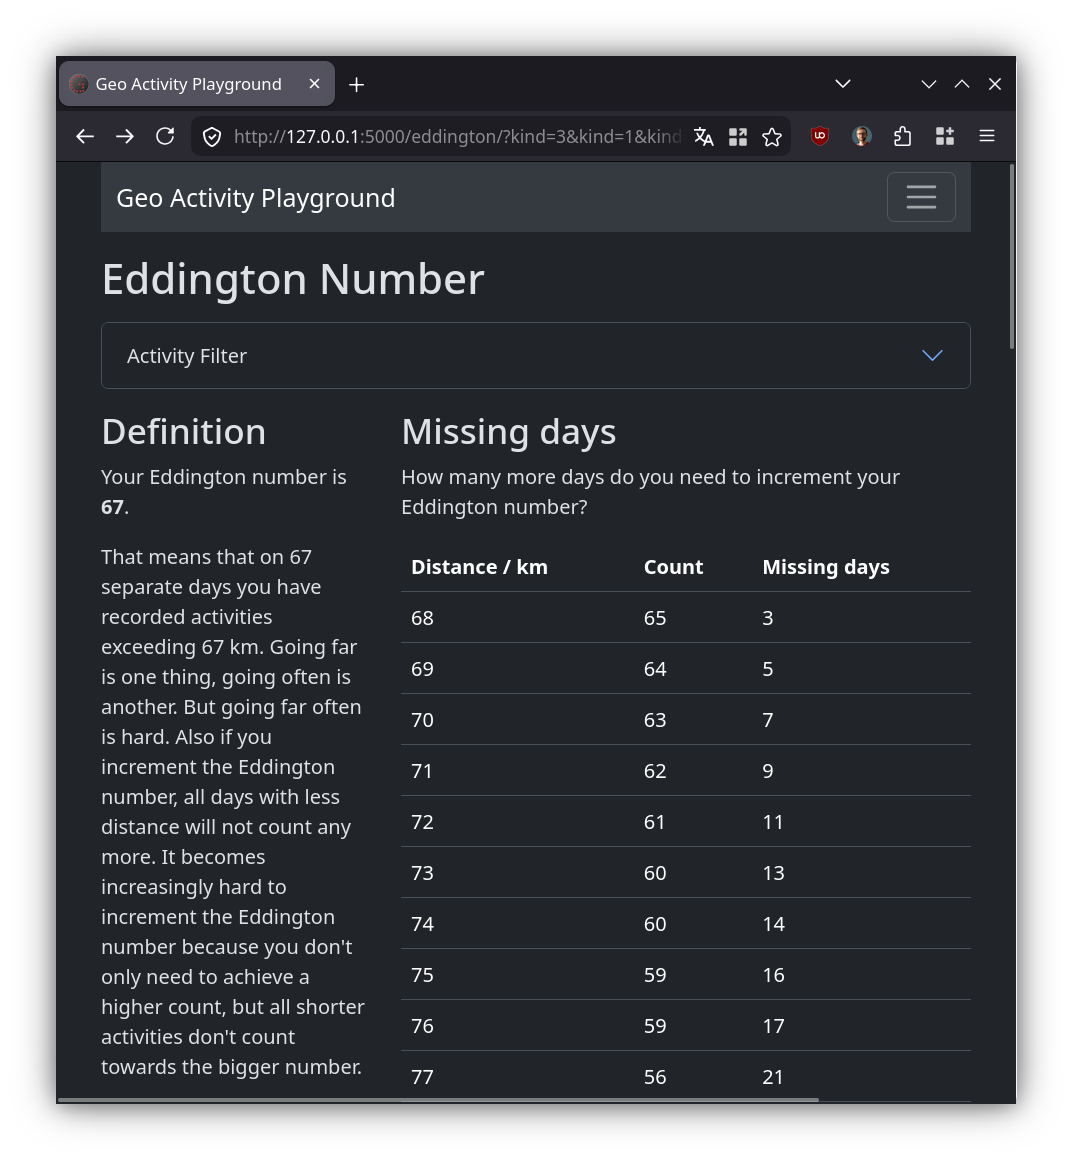
The Eddington number tells you how many days you have exceeded a given distance, and how far you'd need to go to push it up:
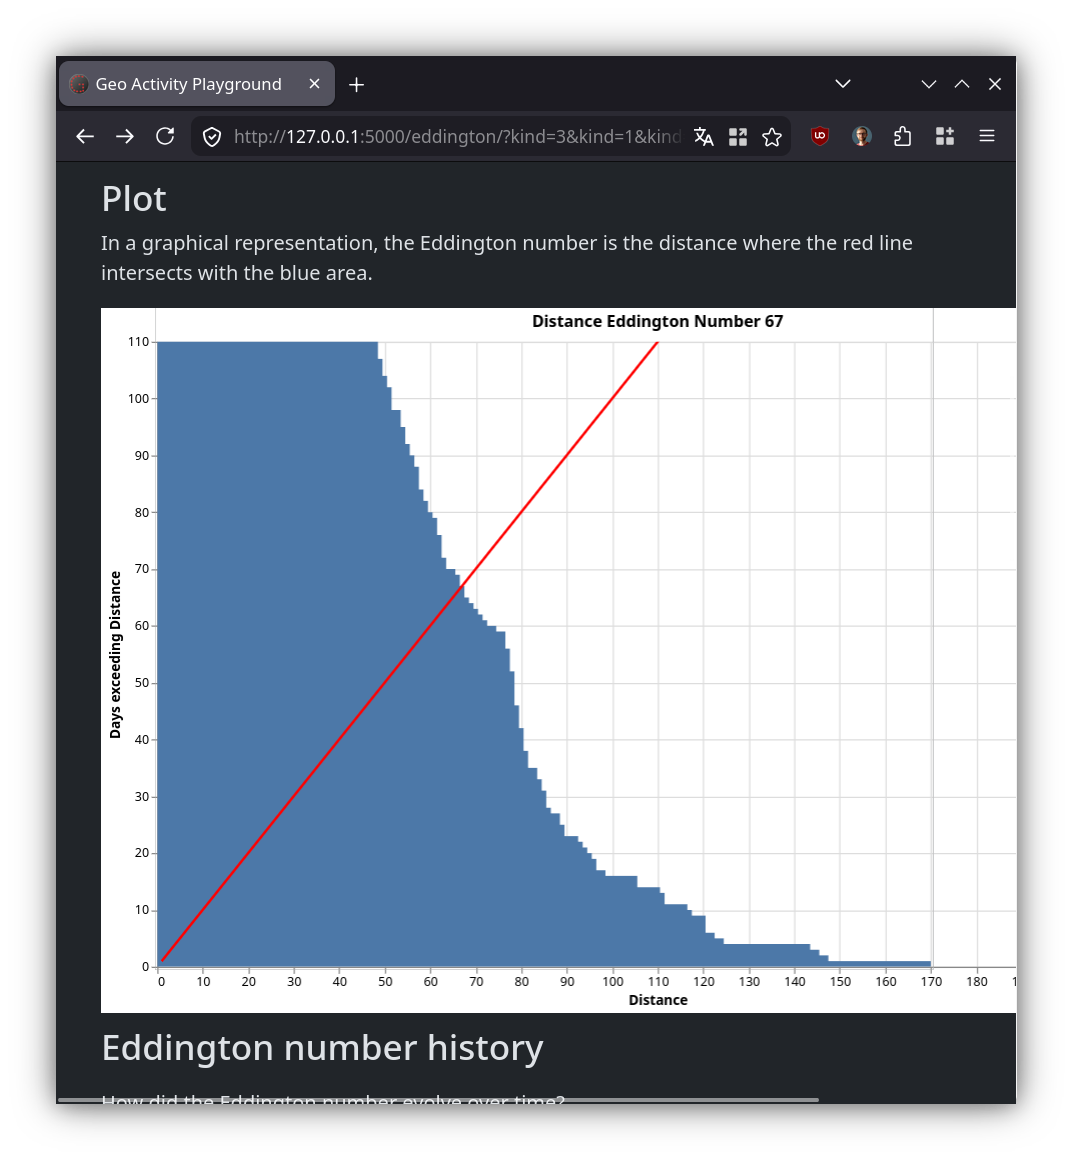
… visualized as the point where the cumulative distance curve crosses the diagonal:
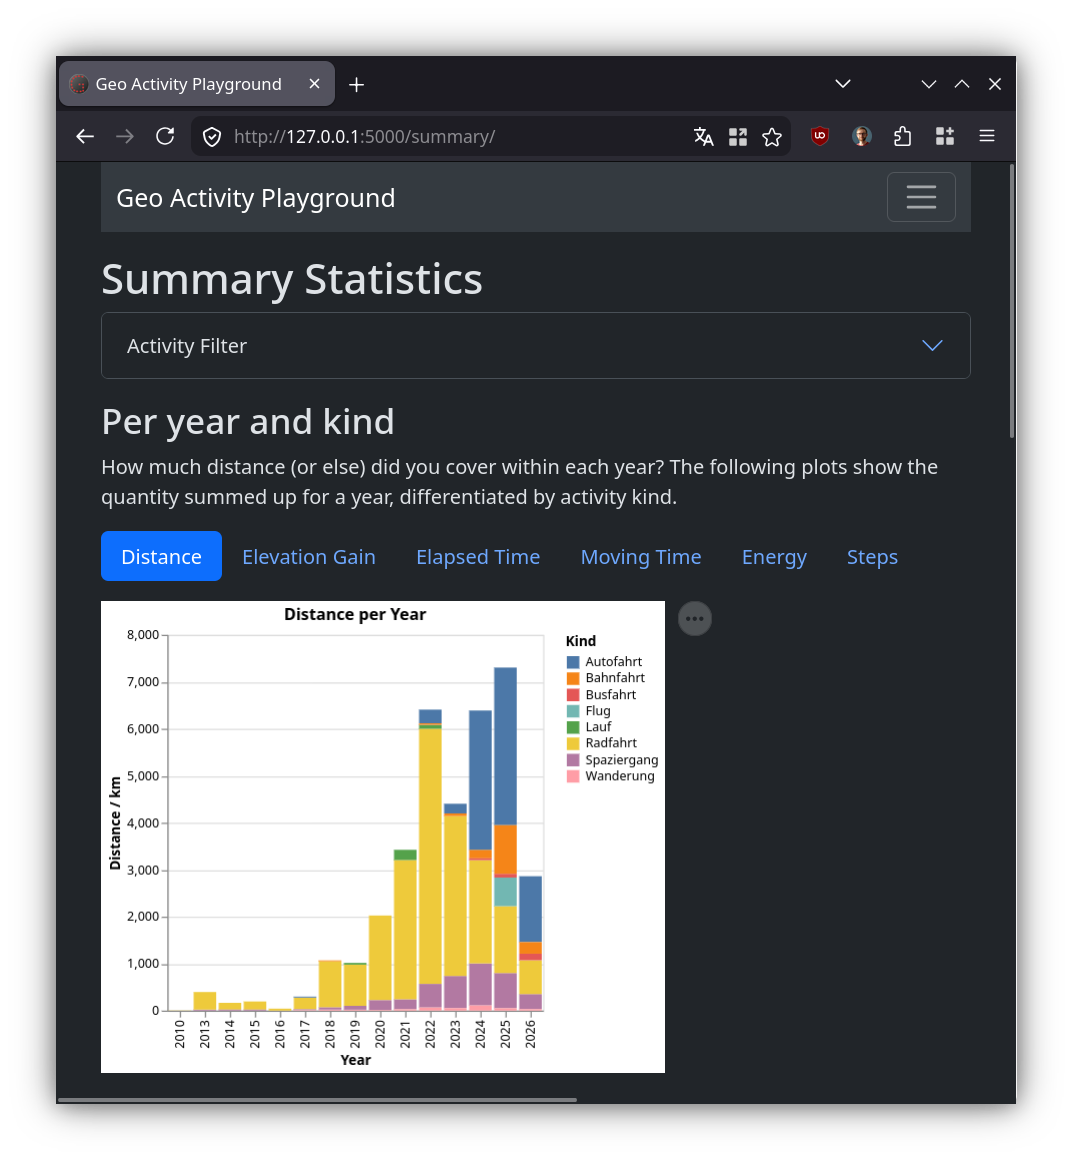
Plenty of summary statistics let you track how many rides, walks, or hikes you have done over the years:
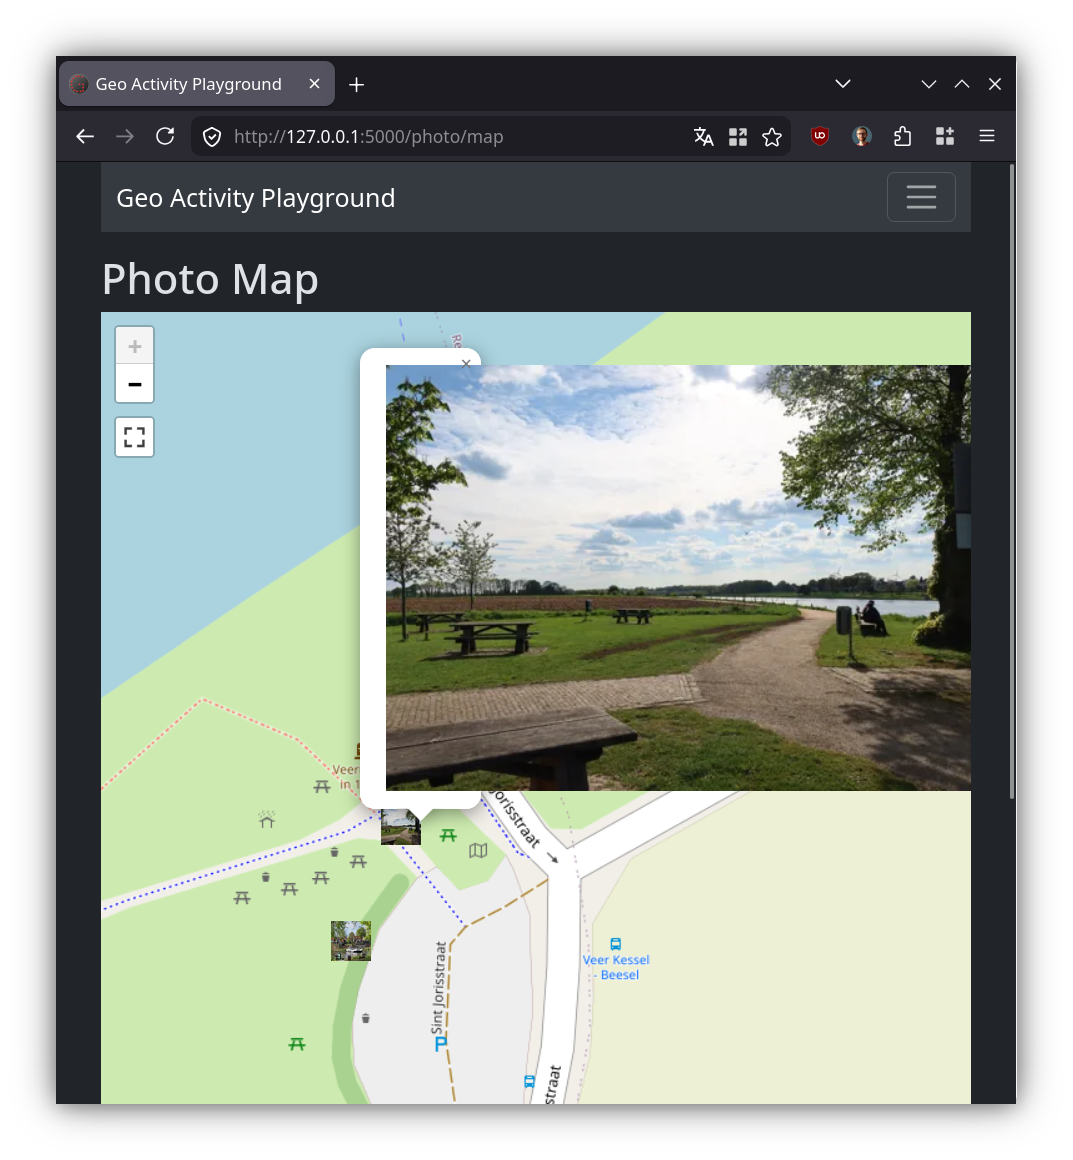
Geotagged photos are matched to the nearest activity and shown right on the map:
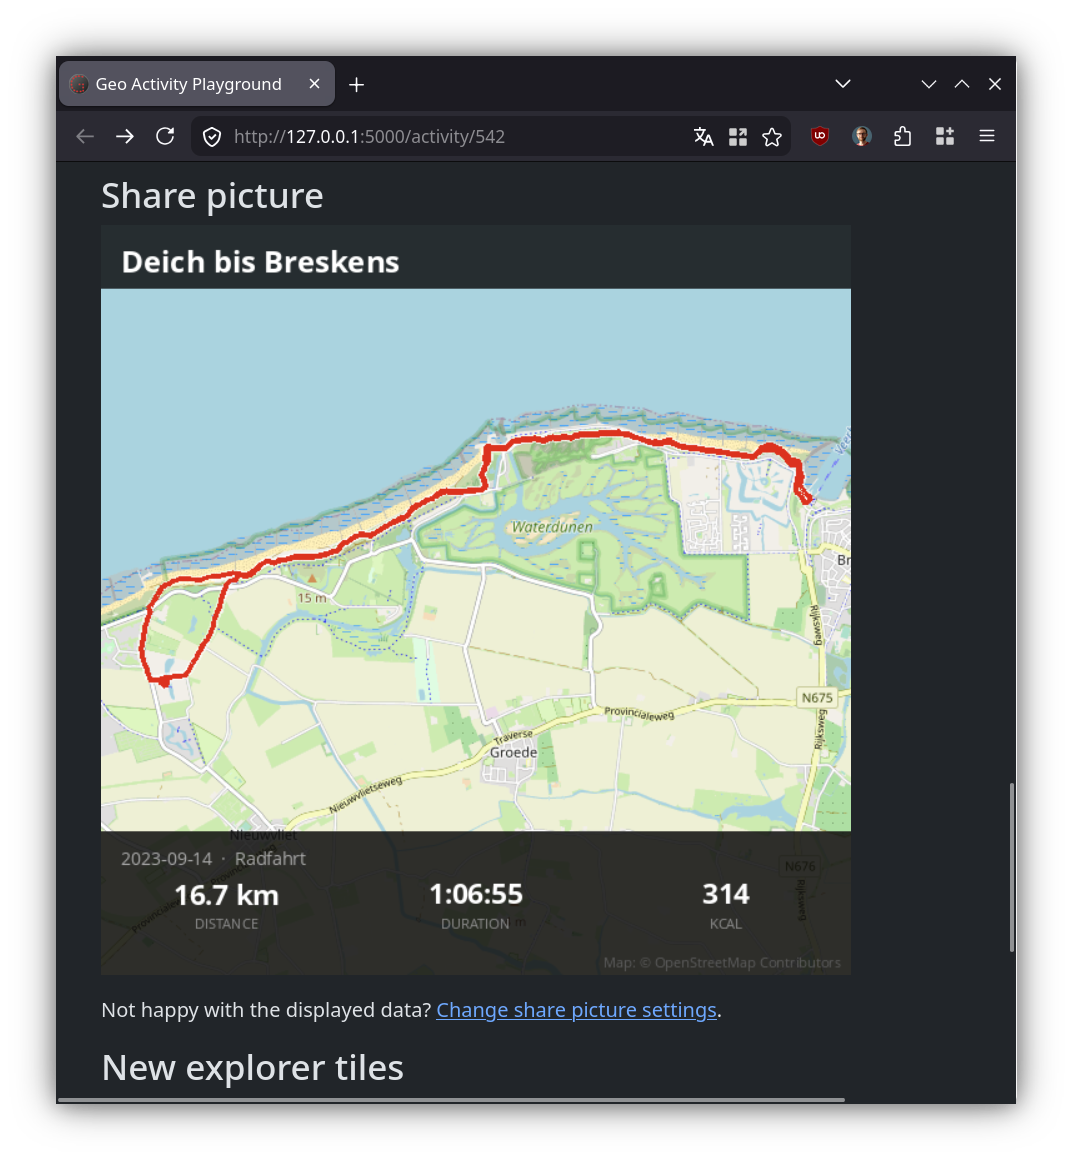
Share pictures let you export a clean map and key figures of an activity:
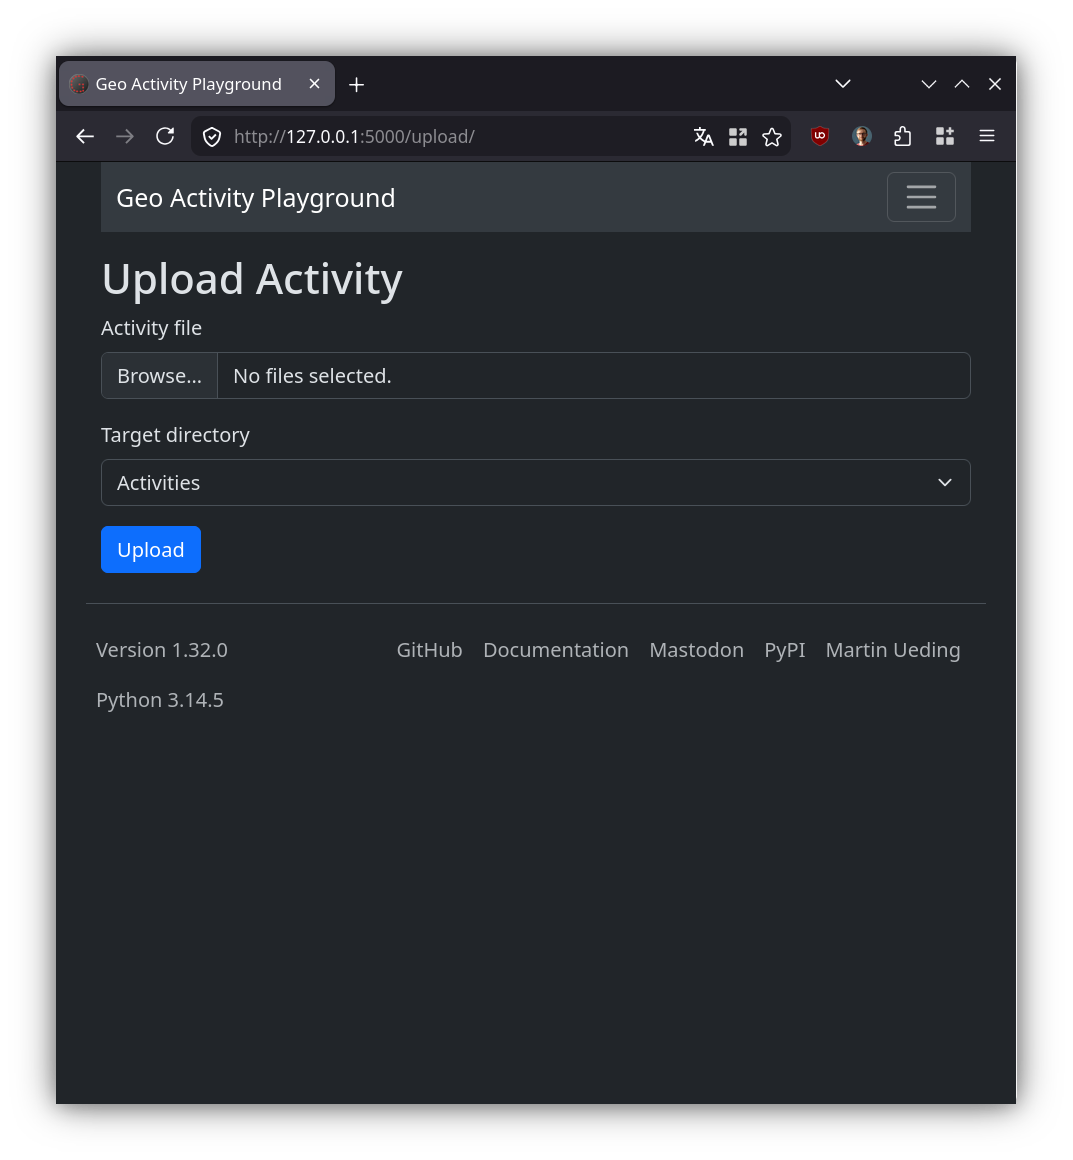
Uploading new activities is just a matter of dropping a file:
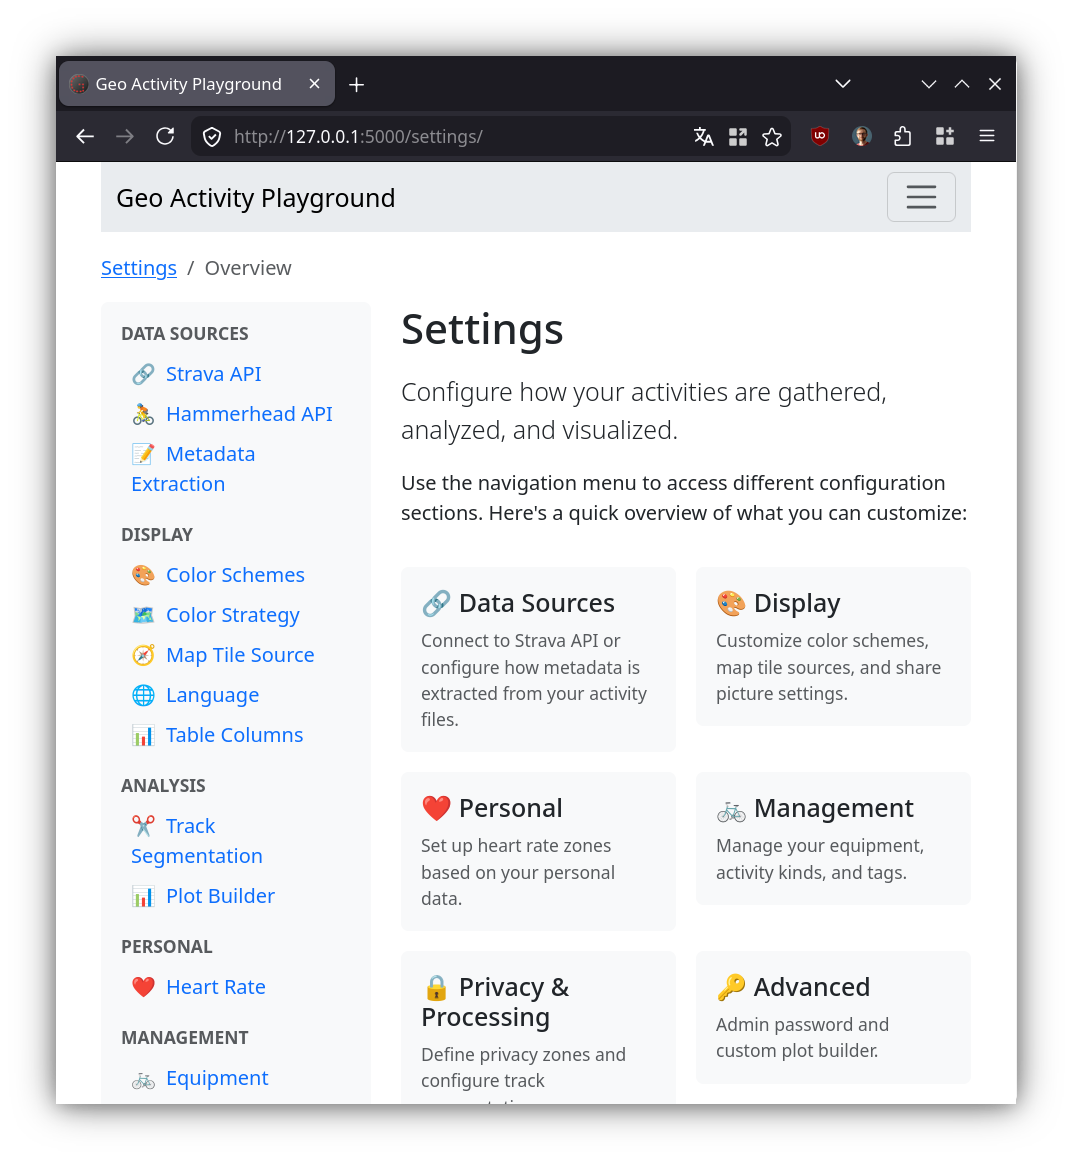
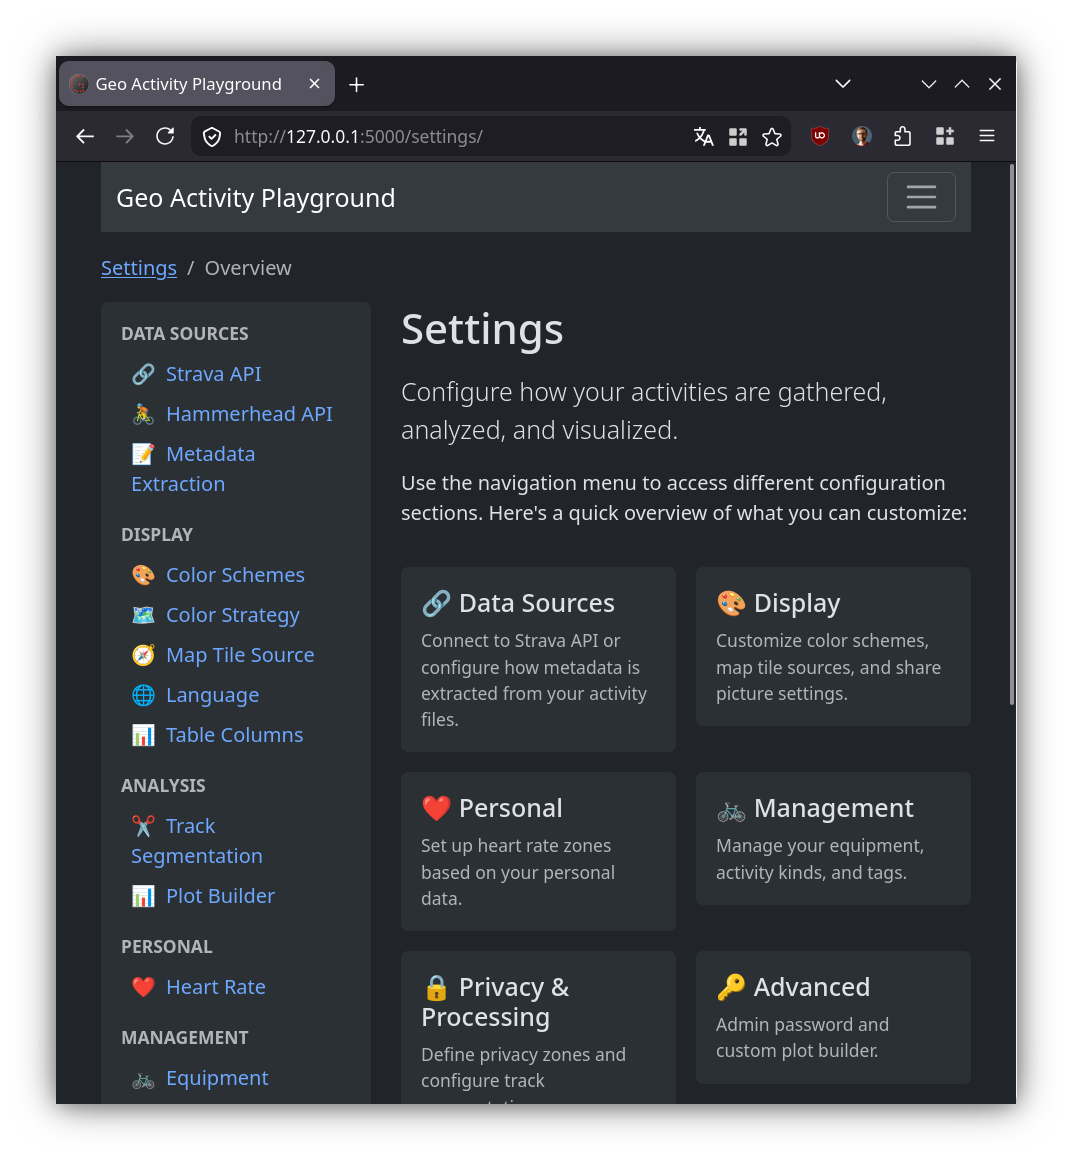
The configuration options are available within the interface such that you do not have to work with configuration files (like in earlier versions):
A light mode is available as well, in case you don't like the dark theme: